Insights Hub
Measure the Business Value of your Agents
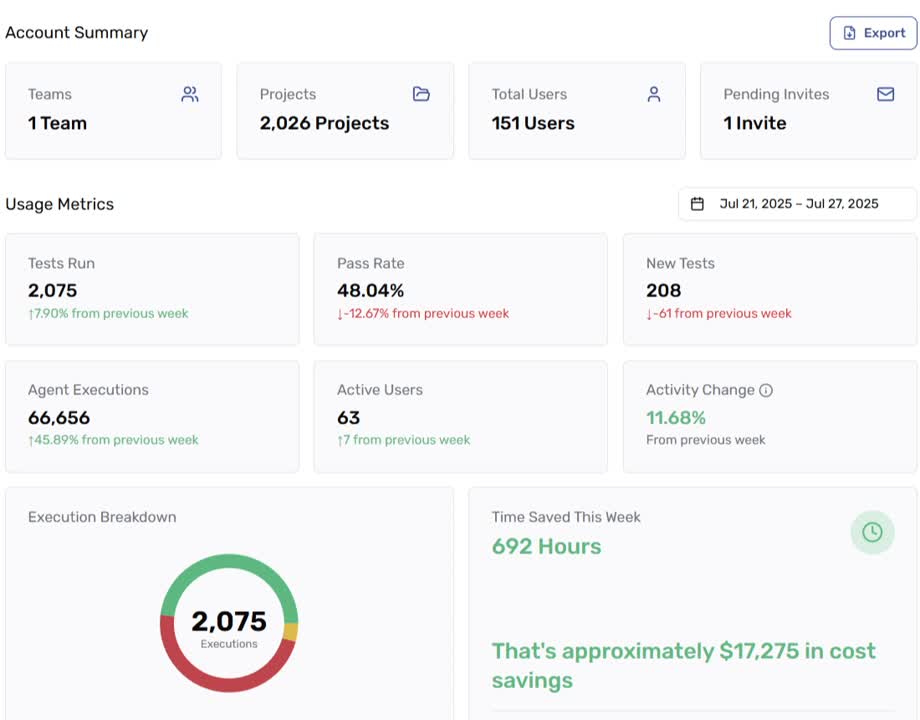
The Insights Hub provides executives and QA leaders with comprehensive visibility into testing performance, adoption metrics, and return on investment. This centralized dashboard delivers:
Real-time adoption tracking
Monitor platform utilization across teams and projects
ROI
measurement
Quantify cost savings and productivity improvements
Performance
analytics
Track test execution success rates and optimization trends
Strategic
planning
Identify opportunities for scaling automation initiatives

Executive Benefits
The Insights Hub enables data-driven decision-making by providing clear metrics that demonstrate the business value of your testing transformation. Leaders can:
Prove ROI: Document measurable improvements in testing efficiency and cost reduction
Scale strategically: Identify high-impact areas for expanding automation
Align objectives: Connect QA outcomes with broader business goals
Optimize resources: Make informed decisions about testing investments
Insights Hub: What Metrics Are Tracked?
Functionize Insights Hub provides holistic insights by tracking critical metrics across key areas of your software testing processes:
Usage Metrics
Users: Total users, active vs. inactive users, average daily activity
Teams: Team size, VMs allocation, and utilization
Projects: Total projects, environments, and authentication protocols
Features: Engagement with agentic automation tools and integrations
Test Metrics
Development: Average test creation time, user-by-user output
Execution: Pass/fail rates, orchestration trends, and browser/device compatibility
Self-Healing: Frequency of successful automated test adjustments
Defect Metrics
Type: Regression, functional, test data/environmental issues
Density: Defect counts by project, iteration, and severity
Defect Detection Percentage (DDP): Percentage of defects caught pre-production
Trend Metrics
Daily, weekly, monthly, and quarterly insights into usage, tests created, defects identified
ROI trends
Don’t leave your testing performance to guesswork. Functionize Insights Hub equips you with the data and analytics you need to optimize efforts, improve ROI, and scale automation across your enterprise.
Ready to
Take Off?
Schedule a demo to see how Functionize is redefining the testing landscape.
Empower your team to achieve superior testing results in record time.


