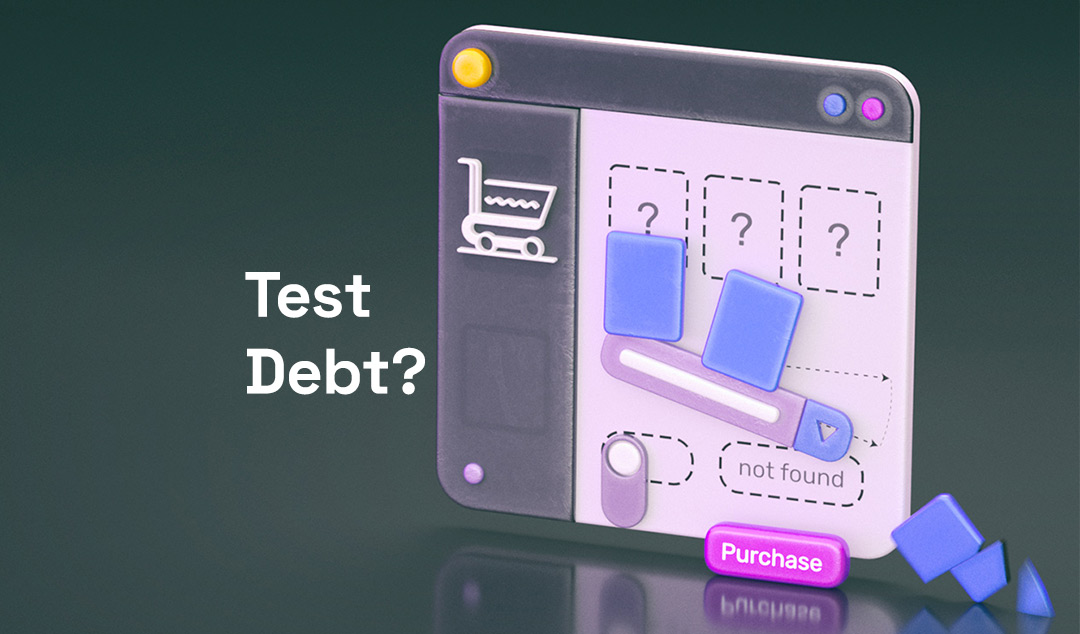
The Test Debt You Don't Know You Have (And How to Quantify It Before Someone Else Does)
Most QA teams are sitting on test debt they've never measured. Here's a three-step framework to quantify it - before a production incident does it for you.
Your dashboards look fine, tests are passing, releases are going out, and the team is heads-down. However, quietly, in the background, a financial clock is ticking, and most QA managers have no idea what it says.
Test debt is the accumulated cost of unmaintained scripts, untested code paths, and coverage that never got built. It doesn't announce itself with an error message. It shows up as a slipped release, a defect escape in production, or an engineer who spent three weeks fixing tests instead of shipping features.
Why Test Debt Is Harder to See Than Technical Debt
Most people conflate test debt with technical debt, but they're not quite the same thing. Technical debt lives in your codebase. Test debt lives in the gap between what your team tests and what your application actually does, and that gap is often invisible until something breaks.
Forrester's Modern Technology Operations Survey, 2025, found that only 27% of IT professionals view technical debt as a code-quality problem. The rest describe it as process gaps, deferred investment, and systems that can't adapt. Test debt fits squarely in that broader picture - it's deferred quality investment, compounding quietly with every sprint.
What makes test debt uniquely dangerous is how well it hides. A test suite of 2,000 cases looks healthy on a dashboard, even though 40% of those tests cover the wrong things, 30% break every release, and another 15% haven't been updated since the features they cover were redesigned.
The Three Faces of Hidden Test Debt
Test debt accumulates in three distinct ways. Each one is measurable and quietly consuming your team's capacity, yet it doesn't appear in any standard QA report.
The Maintenance Trap
As a test suite grows, maintenance starts consuming the time that was meant for new coverage. QA teams spend up to 70% of their effort maintaining existing tests rather than building new ones. That ratio worsens over time as the application evolves and old scripts fall further behind.
Gartner Peer Community research confirms that 93% of engineering leaders are currently experiencing technical debt - and tests and test automation rank among the most common forms.
The Coverage Illusion
High test counts are not the same as high coverage. The 2026 State of Testing Report from Practitest shows that the dominant QA KPIs are Test Coverage at 56.4% and Automation Coverage at 40.1% - both of which measure activity, not protection.
The gaps most often live in exactly the places that matter most:
- Complex user journeys
- Integration points between services
- Authentication flows that were automated early, but never revisited after the product evolved
The Invisible Infrastructure Cost
Framework maintenance is a stealth budget line that rarely appears on any QA report. Selenium grid upkeep, browser driver updates, flaky test diagnosis, and CI/CD pipeline debugging all consume real engineering hours without producing a single new test.
A team running 2,000 automated tests at a 32% breakage rate, 3.5 hours of fix time per test, and 26 releases per year can quietly burn over 55,000 hours annually on pure maintenance labor (Functionize ROI Model, 2025).
Why Most Teams Never See It Coming
Test debt is hard to spot because it masquerades as normal QA operations. The warning signs are usually there - they're just easy to explain away in the moment.
Here are the most common signals that test debt is already significant:
- Test maintenance takes longer than expected every sprint: Fix time keeps creeping up, but it is never flagged as systemic - just another one-off.
- Coverage metrics look steady, but defect escapes are rising: The tests are running fine; they're just testing the wrong things.
- Engineers are quietly avoiding the test suite: Morale around automation is low, and experienced people keep finding reasons to work on other things.
- New features are manually tested because automation is not ready: coverage debt is accumulating in real time, sprint by sprint.
- Release cycles are lengthening without a clear cause: The suite can't keep pace with the build, but no one has quantified why.
None of these signals requires a new tool to detect. They're visible in sprint retros, standups, and release post-mortems - if you know what you're looking for.
The Four Components of Test Debt (and How to Measure Each One)
Quantifying test debt requires examining four distinct cost centers. Most teams only see one or two of them.
1. Maintenance Cost Per Release
Take the number of automated tests in your suite and apply a realistic breakage rate per release. Industry benchmarks suggest this typically runs 20–35% for teams using traditional automation frameworks. Multiply broken tests by average fix time per test, then multiply by your number of releases per year.
2. Coverage gap cost
This is harder to quantify but arguably more important. Start by listing every critical user journey and assigning one of three coverage statuses:
3. Flakiness Tax
A flaky test costs far more than the minutes it takes to re-run. It erodes trust in the entire suite. When engineers start assuming that red is probably a false positive, they stop treating the CI pipeline as a reliable signal.
This leads to defects escaping to production - a cost that shows up in incident reports, not test metrics. Track your false positive rate over the last 90 days. If it's above 5%, you're paying a significant trust deficit on every build.
4. Opportunity Cost
Every hour an SDET spends on test maintenance is an hour not spent expanding coverage, improving test strategy, or building smarter test infrastructure.
McKinsey research indicates that organizations with high technical debt deliver new features 25–50% slower than their peers. In QA, that drag is often traced directly to maintenance burden - not to team size or tooling gaps.
A Simple Formula to Put a Number on It
You don't need a perfect model to start this conversation. You need something credible enough to be taken seriously in a planning meeting. Here's a formula any SDET can run:
Annual Test Debt Cost = (Total automated tests × Breakage rate per release × Fix time per test × Annual releases) × Fully-loaded hourly rate
+ (Hours per sprint spent on test investigation and re-runs) × Sprints per year × Fully-loaded hourly rate
Making the Business Case to Leadership
With all numbers in hand, you have everything needed to walk into an executive conversation with a position, not just a problem. The goal is to present test debt the way a CFO would present balance sheet risk: as a known liability with a quantified cost and a clear remediation path.
The World Quality Report 2025-26 found that only 43% of organizations are experimenting with Gen AI in QA, and only 15% have scaled it enterprise-wide. Most QA managers haven't yet connected operational pain to financial language.
When you bring the maintenance cost model to your VP of Engineering before a crisis, you define the solution. When the conversation starts after a production outage, someone else defines it for you, and QA rarely comes out of that conversation looking like a strategic function worth investing in.

Bottom Line: Quantify It Before Someone Else Does
Test debt is a business risk that happens to live inside your test suite - and it will be named eventually, one way or another. The only question is whether you name it proactively, with a model and a remediation plan, or reactively after a release failure.
The framework above can run in less than 2 weeks using the data you already have. It doesn't require a new tool, a new headcount request, or an executive mandate. It just requires the discipline to put a number on what was previously only a feeling.
The teams that measure their test debt first are the ones who get to decide how to pay it down. The ones that don't measure it find out what they owe when the bill arrives as a 2 a.m. production incident.
Ready to see AI-powered testing in action? Book a personalized demo or start a free trial to see how Functionize helps QA managers quantify and eliminate test debt at scale.