Improve your debugging strategies
How do we know when our debugging strategies doesn’t work and what alternative strategies can we adopt so we can find bugs more easily?

Developers sometimes try to use feature development strategies to find bugs—and that doesn't always work. How do we know when our debugging process doesn’t work? and what alternative strategies can we adopt so we can find bugs more easily?
Something is wrong in your application.
One part of the system sends messages to another part. It works, except sometimes, it sends an extra, errant message. You’re not sure why the extra messages happen, but you want to find out and stop them.
You have a hunch about what might cause the problem, so you try changing that. It doesn’t work!
Hmm. You can think of one other possible cause. So you change that. It doesn’t work either!
Your exploratory changes start to feel more and more random. You feel frustrated, and you’re not sure about the right next step.
You’d like to know that you are making progress, even if you haven’t found the issue yet. In other words, you’d like a debugging strategy.
Here’s the most common debugging strategy
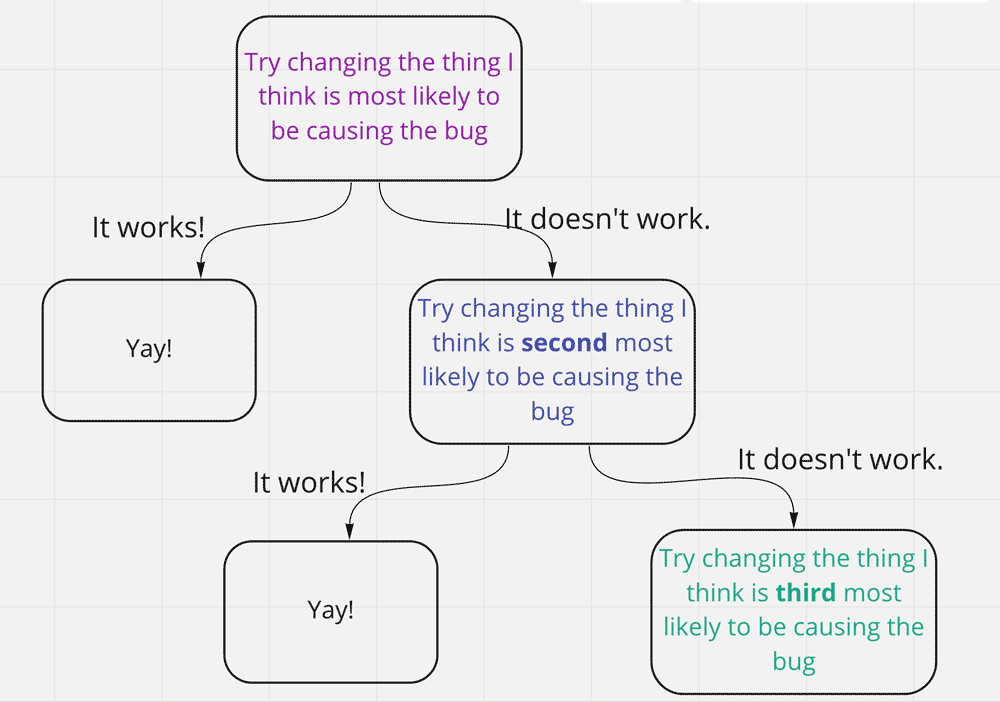
This is how we usually do things: We try changing the thing we think is the most likely cause of the issue in our code. If that works, great! We solved the problem. If it doesn’t work, we try changing the thing we think is the next most likely item causing the issue in our code, and so on.
I call this strategy the standard strategy. This is often the quickest way to diagnose the bug, assuming we understand the code’s behavior. We can move fast when we wish to push forward with new functionality or large refactors. This is the mode demonstrated in most programming tutorials, and it’s the one celebrated by product owners and hiring managers.
It has a problem, though: The less we understand the behavior of our code, the lower the correlation between the things we think are causing the bug and the thing that’s really causing the bug, and the weaker this strategy becomes. So we get end up in vicious cycles:

Have you ever gotten so frustrated while searching for an issue in your code that you tried something you know you already tried, just to see if it works this time? That is the point where a different strategy might work better.
Learning to investigate
Choosing a different strategy means first shifting our mindset. So far we have been in progress mode, trying to change the software with speed. We need a second mode: investigation mode.
In investigation mode, we are no longer focused on pushing changes. Instead, we focus on narrowing down the problem space by testing our assumptions. “Success,” in investigation mode, is not an incrementally broader feature set. Instead, it is an incrementally tighter feedback loop in which we experiment with the thing we don’t understand in order to gain an understanding.
The gold standard here is often a failing test that replicates a problem. Any tactic with a tight feedback loop works, though—the tighter the better.
We are reluctant to shift into investigation mode because, unlike progress mode, it doesn’t feel fast. Nevertheless, when we deal with unknowns, a precise investigation can help resolve issues in less time (and with much less effort) than the brute-force approach of progress mode.
For example, I ran into a problem with image upload on an application that processes NASA LandSat data. Upload happened at the very end of the processing pipeline, which took about 20 minutes to run. So even though I had a pretty good guess at the cause of the problem, testing my theory would take at least 20 minutes. Instead, I wrote a little script to rerun the exact portion of the code that failed and made sure I could reproduce the issue. Voila! That script allowed me to rerun the failing code in a matter of seconds. So when it turned out that my guess about the problem was wrong, I could check a lot more possibilities much faster than if I had to run the whole pipeline each time. You can follow me step-by-step through that exact bug right over here.
What kind of strategies might help us narrow down where a bug is happening?
We could use a binary search to find the problem
In this strategy, we assume that the code path follows a single-threaded, linear flow from the beginning of execution (where we run the code) to the end of execution, or when the issue happens.
We choose a spot more or less in the middle of that flow. Then we print, log, or breakpoint to test our assumptions about the pieces of code that would contribute to the issue. If something looks off, we move backward, choose another point halfway between that starting point and the beginning of execution, and test our assumptions again.
By contrast, if everything looks good, we move forward, choose a point halfway between the starting point and the end of execution ( or when the issue happens), and test our assumptions there instead.
Each time we jump, we reduce the size of the potential problem space by half. Even in enormous code bases with long threads of execution, we can isolate the location of an issue in just a few hops with a binary search.
There are cases where binary search won’t work: namely, cases where the code path does not follow a single-threaded, linear flow from the beginning of execution to the end.
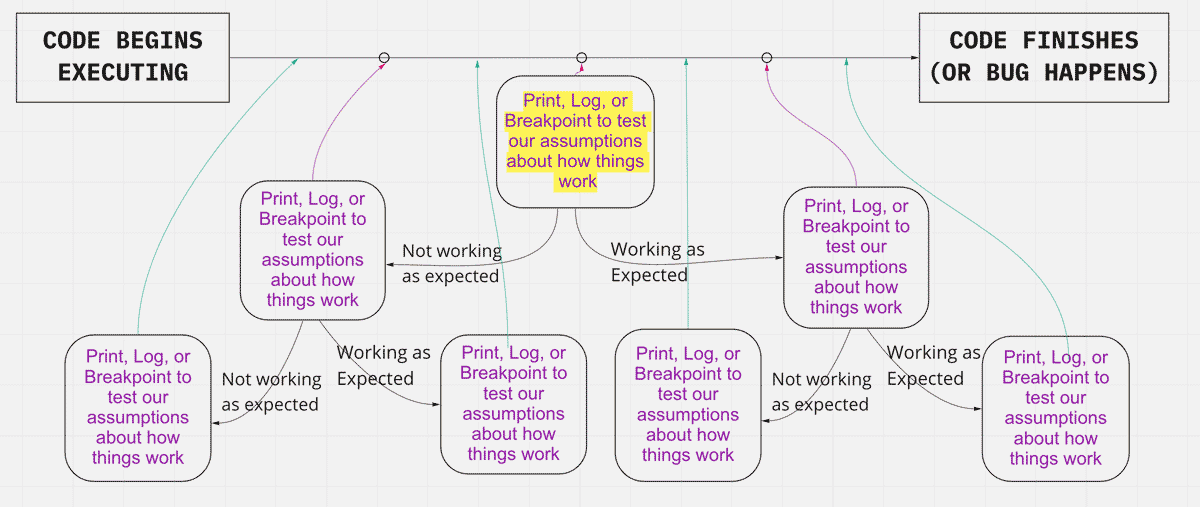
Instead, we may need to systematically trace the code path
This approach is simpler to communicate than the binary search strategy. It follows the logical line of inquiry and results in fewer misinterpretations. Depending on the length and complexity of the process you’re debugging, this strategy might take longer than the binary search strategy, but sometimes it works better for multi-threaded or asynchronous processes that are hard to map onto a linear flow for using binary search.

In this strategy, we begin right where the code begins executing. Test the assumptions there, at the starting point. If everything looks good, we take the next step forward towards the end of the process (or the spot where the issue happens), and test our assumptions again. Even if we think that the problem occurs toward the end, we do not skip to that spot. Instead, we systematically move through the steps of the process from the beginning, making sure that the state of our system matches our expectations at every point.
Remember: if we’re struggling to resolve an issue, there’s probably something we don’t understand about what’s going on. At least one of our assumptions doesn’t match up with reality. This systematic approach helps us find out where that is.
To help us differentiate our assumptions from system behavior, it can be helpful to explicitly list our assumptions and checks. As we follow the process, at each point where we stop, we can write down a list of three things:
- Givens: Stuff that we assume to be true at this point
- Checks: Things that we are checking with print statements, logging, break points, etc.
- Results: What we saw when we tested out each of our checks. Did it match expectations?
This practice of recording our steps during a debugging session has little to do with remembering what we did (though it does help with that). Rather, we are training our brains to spot our own assumptions.
You’ll know it’s working if your “given” lists start getting longer. We especially remember to include givens that weren’t what we thought when we hunted down previous bugs. We build this intuition when we get better at debugging through practice. That teaches us to recognize our assumptions, which we previously mistook to be plain old truths. That’s how we get stuck. And to get unstuck, we need to find the inaccuracies that are hiding in our only partially correct understanding of how the code works.
There’s another advantage to identifying common patterns in our wrong assumptions (at least the ones that cause bugs). Doing so lets us improve our language-agnostic debugging intuition. That’s right: the skill of recognizing our own assumptions helps us debug more effectively even if we switch tech stacks.
What about issues that only appear sometimes?
Among the most frustrating bugs are those that crop up erratically. These types of problems have a special talent for eluding programmers—sometimes for days, sometimes for years! They usually happen for one of two reasons:
- Defining the process too narrowly. Our idea of where our code begins and ends, and everything in between, is missing some variable. Maybe it’s an environment variable. Maybe it’s a race condition. Maybe it’s an edge case that we haven’t yet identified. To find it, we have to broaden our scope. What are we placing outside the set of things we’re looking at that actually belongs inside it?
- One of the givens is only true sometimes. This kind of bug tries developer and tester patience more than any other kind. They’re difficult to track down because, even when we check our givens, those givens might turn out to be accurate…this time. We have to check them multiple times, and hope that each time we re-check it, it does the thing it might only do sometimes.
When to switch modes
Most developers and testers are excellent at working in progress mode, where we focus on pushing changes to a software system at a quick pace. But that happens when we understand exactly what the system is doing. Hard-to-find bugs, by definition, represent something we don’t understand. At that point, it’s time to switch strategies. Focus on investigation — to narrow down the things that could cause the problem.
Both investigation strategies need us to recognize and test our assumptions. What do we think is true at this point? How sure are we? Can we use a print statement, a breakpoint, a logging statement, or another means to test our assumption? We can even keep a written record of our assumptions, checks, and results as we debug to help ourselves get better at our cross-platform debugging skills. Tools can help with the bookkeeping, but it’s the human skill that finds the “oh that’s why!” source of the problem.
Debugging can sometimes feel tedious and frustrating, but a few overarching strategies can help us debug with confidence and reveal the issue.
Want more help debugging? Functionize helps you create and maintain tests, which can sure make your life easier. For instance, take a few moments to explore our features for self-healing test maintenance.